There is always a third solution... Standard Addition! :)
Quantification with Standard Addition is often used when the matrix of the sample can significantly modify the analytical sensitivity of the measurements.
I've performed this procedure with dust samples(dirty enough!) and LC-UV analysis.
I'll try to explain this procedure in the simplest way. :)
Let's imagine to have four samples, same volume and unknown concentration of analyte.
 |
| David L. Zellmer (1998) |
A series of increasing volumes of stock solution (solution with isotopically marked carbons) are added.
According to the literature: "The concentration and volume of the stock solution added should be chosen to increase the concentration of the unknown by about 30% in each succeeding flask".
My tip is to increase it more than 30%. I'll explain later why.
It's not necessary filling up the vials with solvents as shown in figure (in our case Vflask in the formulas is referred to our volume of sample+standard).
Just remember that this step has to be performed before the extraction, since standard solution and sample have to follow the same steps (extraction and cleaning up).
The concentration of analyte is given by:
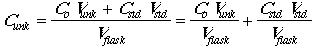
The concentration of analyte is given by:
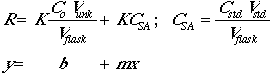
The instrumental response of the analyte will be R = K x (concentration), so:
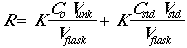
Now set Csa = CstdVstd/Vflask.
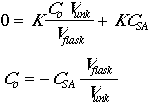
To obtain our CSA we should extrapolate for y=0, of course we need a positive value.
Now set Csa = CstdVstd/Vflask.
To obtain our CSA we should extrapolate for y=0, of course we need a positive value.
It's necessary, as for Internal and External Standard protocol, building a calibration line.
We should prepare at least six levels.
Levels are made by standard solution with different concentrations (the 1st level has standard concentration equal to zero).
They are useful to understand the real response of the machine to the different concentration.
Of course these levels go directly to the analys without any other treatment.
Plotting the pick areas, obtained from the measurement, with the concentration we should obtain a linear function.
They are useful to understand the real response of the machine to the different concentration.
Of course these levels go directly to the analys without any other treatment.
Plotting the pick areas, obtained from the measurement, with the concentration we should obtain a linear function.

The theoretical concentrations of standard solutions have to be divided by the calibration line's slope. In this way we'll obtain a new set of concentrations. Plotting these new real concentrations with the instrumental response gives us the right trend line and x-intercept, so the real analyte concentration.

As you can understand, drawing a right trend line is important to obtain the right x-intercept.

In my example the systematic error is quite big! :(
To avoid this kind of error we could:
To avoid this kind of error we could:
- add another measurement to the experiment, so that we could draw a best trend line with five points;
- choose bigger gaps between the increasing amount of standard solution, in this way we could move our points in the graph, and obtain a trend line more definite.
I think that's all folk, i hope i've been clear enough!
Good luck with Standard Addition!!! :)
Nessun commento:
Posta un commento